Monitoring of OpenWRT
Intro
I have 3 WiFi routers running OpenWrt. My setup is described here. For some time, I’ve been considering adding monitoring for it. Internet searches led me to discover Grafana Cloud with a local Prometheus setup for this purpose. I wanted to experiment with these tools and decided to give it a try. Several excellent articles and resources helped me; thanks to the authors for sharing them! The links I used are below:
- https://grafana.com/blog/2021/02/09/how-i-monitor-my-openwrt-router-with-grafana-cloud-and-prometheus/
- https://gist.github.com/danpawlik/cbec3d9ae1fbf4652a86c6cafc7bd652
- https://www.cloudrocket.at/posts/monitor-openwrt-nodes-with-prometheus/
Below are the main steps and configurations I followed for my setup. I’ve been using it for ~24 hours and love the results. It allows me to understand how the access points are utilized and assess signal quality, enabling necessary adjustments.
Hardware and Software
The setup includes:
- 3 Xiaomi Redmi Router AC2100 devices running OpenWrt v23.05.5 to gather metrics
- A Mac mini with Docker for hosting the Prometheus server and sending metrics to a Grafana Cloud (free account)
Configure OpenWrt
This setup was applied to all 3 routers via SSH.
-
Update the list of packages and install Prometheus exporter packages:
opkg update opkg install prometheus-node-exporter-lua \ prometheus-node-exporter-lua-nat_traffic \ prometheus-node-exporter-lua-netstat \ prometheus-node-exporter-lua-openwrt \ prometheus-node-exporter-lua-wifi \ prometheus-node-exporter-lua-wifi_stations -
Edit the
/etc/config/prometheus-node-exporter-luafile. The final version looks like this:config prometheus-node-exporter-lua 'main' option listen_interface 'lan' option listen_port '9100' option listen_ipv6 '0'Note: You can check the interface name in the
/etc/config/networkfile. -
Restart the service to apply the changes:
/etc/init.d/prometheus-node-exporter-lua restart -
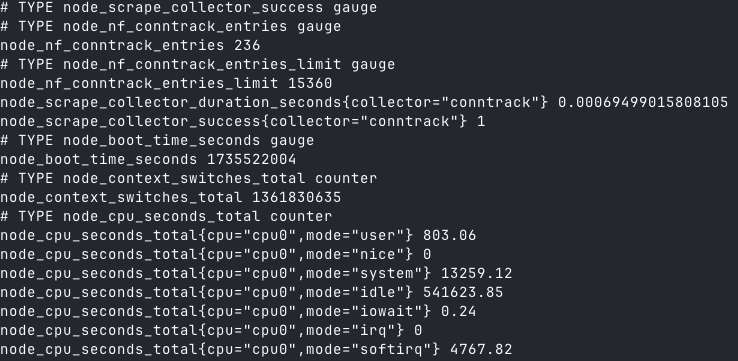
(Optional) Test that you can access the metrics. From a computer on the same network, run:
curl ROUTER_IP:9100/metricsThe output should look like this:
Create Grafana Cloud Account
The next step is to create a Grafana Cloud account (if you don’t already have one) and obtain a Prometheus endpoint with credentials.
Once the account is created, go to Connections -> Add new connection -> Hosted Prometheus metrics and generate a new token.
Save the following details for later:
    remote_write:
      - url: https://prometheus-instance.grafana.net/api/prom/push
        basic_auth:
          username: *****
          password: *****
Configure Local Prometheus Server
I have a Mac mini in my network that’s always running, so I’m using it as my Prometheus server for this configuration. It runs inside a Docker container.
-
Create a Prometheus config file (
~/tmp/prometheus.yaml). The content of my file looks like this (replaceIP_ROUTER_X, Prometheus endpoint, and credentials with the appropriate values):global: evaluation_interval: "1m" scrape_interval: "1m" scrape_timeout: "10s" scrape_configs: - job_name: node static_configs: - targets: - IP_ROUTER_1:9100 - IP_ROUTER_2:9100 - IP_ROUTER_3:9100 remote_write: - url: https://prometheus-instance.grafana.net/api/prom/push basic_auth: username: ***** password: ***** -
Create a Docker volume for metrics:
docker volume create prometheus-data -
Run the Docker container:
docker run -d \
    -p 9090:9090 \
    -v ~/tmp/prometheus.yaml:/etc/prometheus/prometheus.yml \
    -v prometheus-data:/prometheus \
    prom/prometheus
Configure Dashboard in Grafana Cloud
Within a few minutes, the metrics will appear in Grafana. You can then import or create a new dashboard.
- Download the OpenWrt Dashboard JSON file from Grafana dashboards or from this GitHub repository.
- Create a new dashboard:
- Navigate to
Dashboards->New dashboard->Import a dashboard. - Upload your JSON file.
- Navigate to
Your dashboard should now be visible and should look like this:
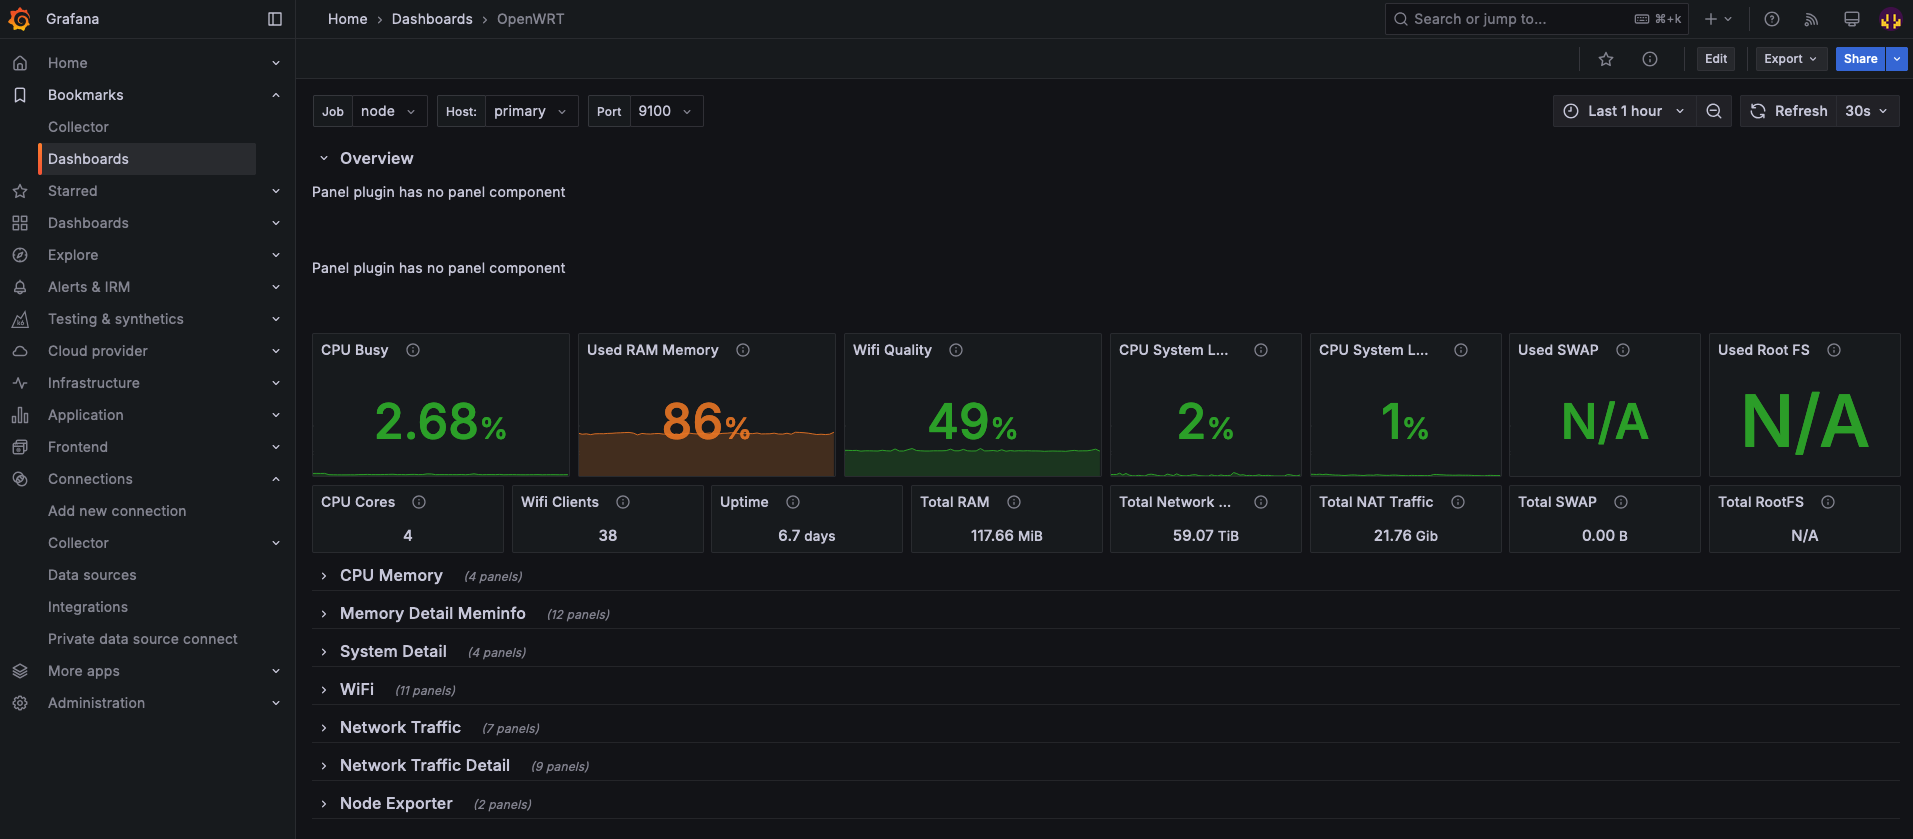
That’s it! Explore and refine your setup as needed.